If you’ve ever managed a complex engineering or product development project, you’ve probably faced this situation:
Everything looks fine on the plan…
Until one small delay quietly snowballs into a missed milestone.
Most project issues don’t happen because teams aren’t working hard. They happen because dependencies aren’t visible early enough. That’s exactly the problem PERT charts were designed to solve.
What a PERT Chart Really Gives You
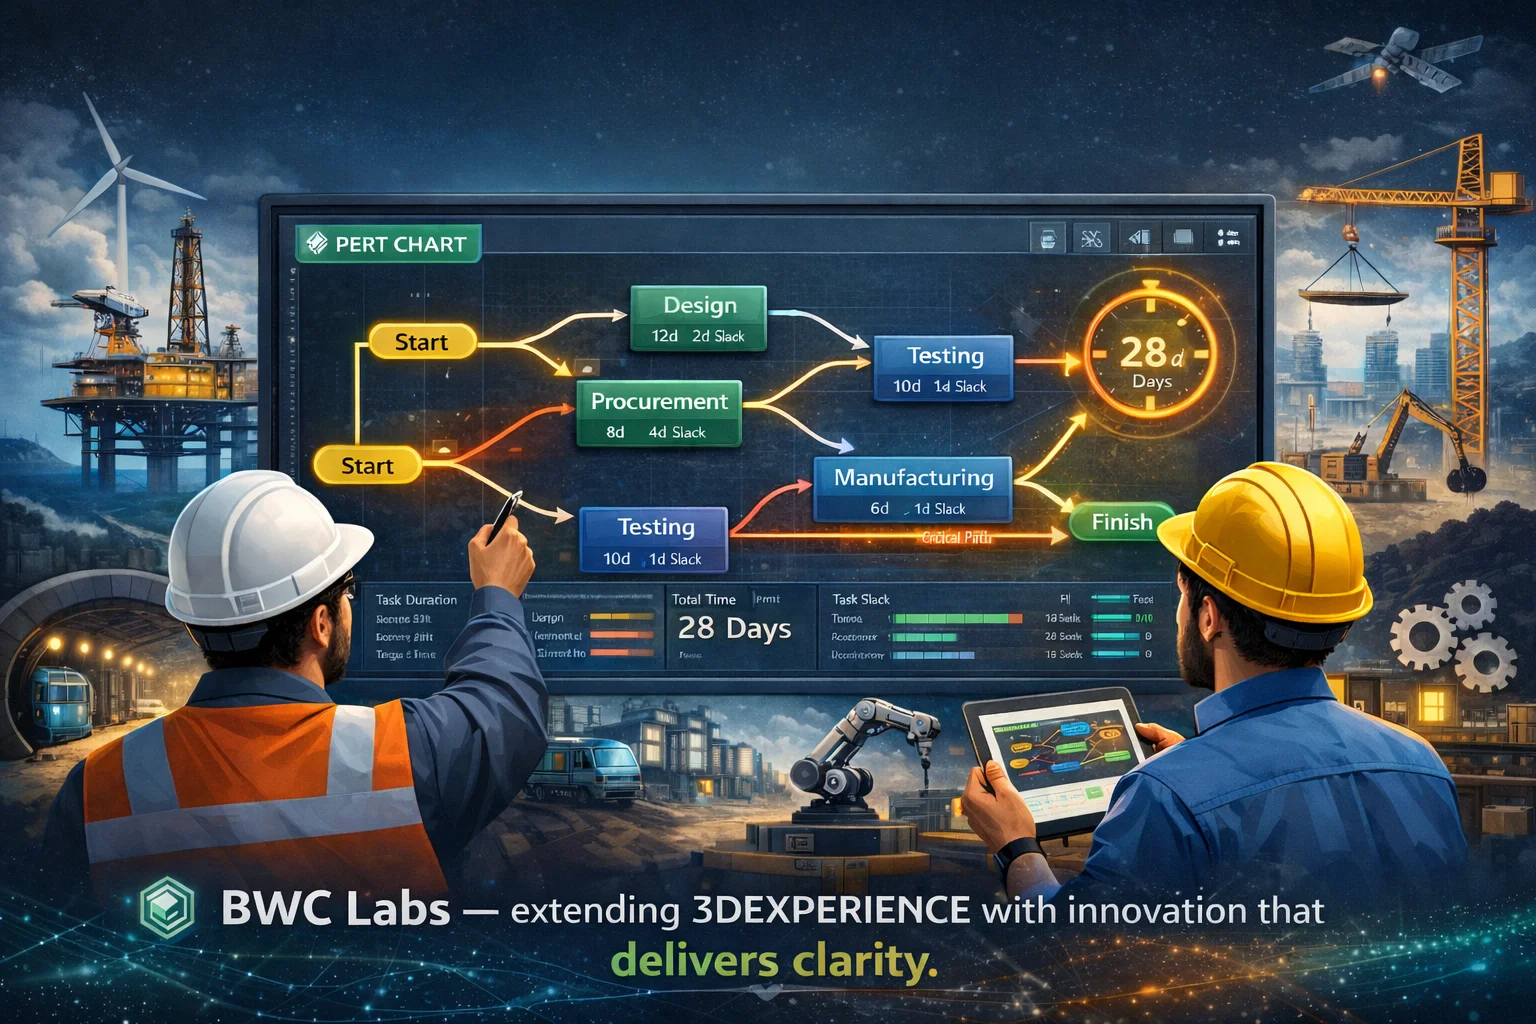
A PERT chart isn’t just another project diagram. It’s a way of thinking through a project visually.
Instead of looking at tasks as a long list, a PERT chart shows:
When you see your project as a network rather than a list, planning becomes clearer, conversations become easier, and surprises reduce dramatically.
The Reality Inside 3DEXPERIENCE Projects
3DEXPERIENCE is a powerful platform for managing programs, tasks, and collaboration. But in real customer projects, we kept hearing the same feedback from project managers and program leads:
“I can see my tasks, but I can’t see the full project flow in one view.”
Without a PERT chart:
For small projects, this might be manageable.
For large, multi-team engineering programs, it becomes a serious limitation.
Why We Decided to Build a PERT Chart for 3DEXPERIENCE
At BWC, we don’t build solutions because a feature is “missing.”
We build them because project teams struggle without it.
During multiple implementations, we saw project managers exporting data to Excel or PowerPoint just to explain dependencies during reviews. That’s when it became clear:
3DEXPERIENCE needed a true PERT-style visualization inside the platform, not outside it.
The BWC PERT Chart Solution – Built for Real Projects
Our PERT Chart solution plugs directly into 3DEXPERIENCE and does one simple but powerful thing:
It shows the entire project as a single, connected network.
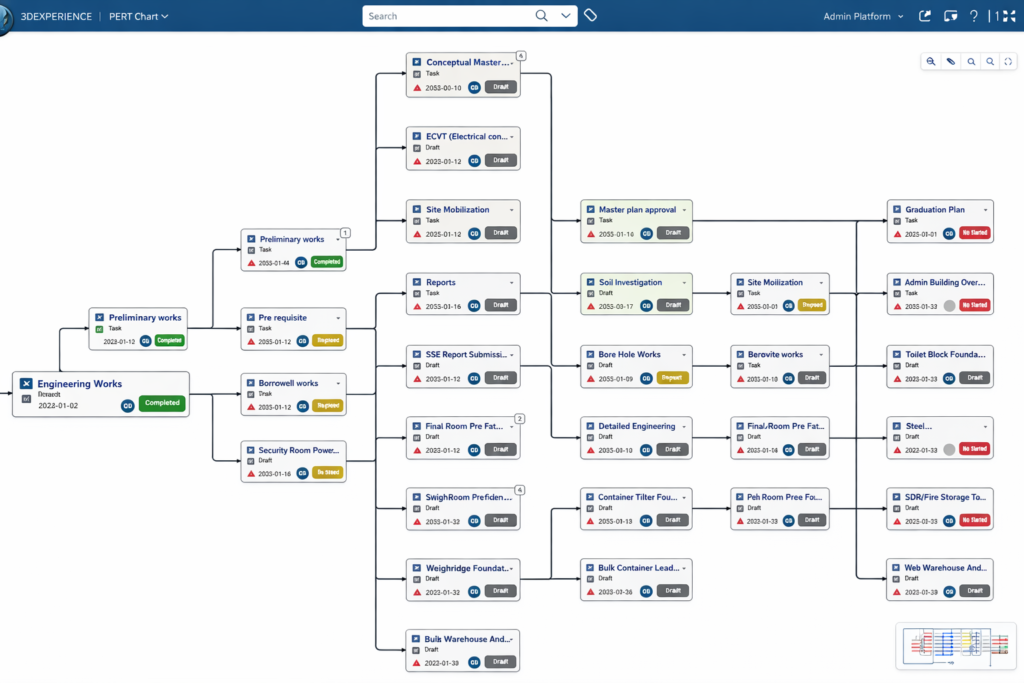
What teams immediately notice:
And the best part?
It works on existing project data no rework, no new processes, no disruption.
The Impact We’ve Seen
Once teams start using the PERT view:
It’s not about adding more data it’s about making the data easier to understand.
Closing Thoughts
Complex projects don’t fail because of one big mistake.
They fail because of small dependencies that stay hidden too long.
PERT charts have always been a proven way to manage this complexity. By bringing that capability into 3DEXPERIENCE, BWC helps teams plan with clarity, act with confidence, and deliver with fewer surprises.
That’s the kind of project management we believe in simple, visual, and practical.
We provide custom software development, cloud solutions, IT infrastructure setup, system integration, and ongoing tech support.
It depends on the scope. Small projects may take 2–4 weeks, while larger systems can take 2–3 months or more.
Yes, we offer maintenance and support packages to keep your system secure, updated, and running smoothly.
Absolutely. Every solution we deliver is tailored specifically to each client’s business goals and operations.
We’ve worked with clients in retail, healthcare, logistics, finance, and more.
Simply contact us through our website or email, and we’ll schedule a free consultation to understand your needs.

At BWC Labs, our mission is to empower businesses with cutting-edge technology solutions. We believe in the transformative power of innovation and are committed to helping our clients achieve their goals.